I have posted a few times challenging the often repeated assertion that advanced banks are subject to materially lower risk weights than their competitors operating under the standardised approach (see here for example).
I have not seen the argument asserted for some time but APRA has chosen to publish a short note repeating their conclusion that the difference is nowhere near as big as claimed.
“APRA estimates that the average pricing differential for housing lending due to differences in IRB and standardised capital requirements is 5 basis points.4 Taking into account the IRRBB capital charge and higher operational costs for IRB banks would further reduce this pricing differential.”
Marc Rubinstein has written another really interesting post on the economics of the American mortgage market which you can find here. The post is useful not only for his account of the mechanics of why the American mortgage market is prone to boom and bust but also for reminding us of some of the ways in which the American approach is very different from that employed in other markets.
I have posted a couple of time on a Discussion Paper published by The Australian Prudential Regulation Authority (APRA) in late 2020 (“A more flexible and resilient capital framework for ADIs”) setting out how it proposes to wrap up a number of prior consultations on a variety of aspects of ADI (authorised deposit-taking institution) capital reform in Australia (see here, here and here).
This post looks at the changes to mortgage risk weights (RW) outlined in the paper and attempts to explore (with limited information) what practical impact they might have. The short version is:
In very broad terms, APRA is seeking to assign higher RW to residential mortgages it deems to be relatively more risky but also lower RW for those it considers less risky
In pursuit of this objective, APRA has proposed two new categories of residential mortgage defined by the loan purpose (i.e. “Owner occupier loans paying principal and interest” and “Other Residential” including loans for investment and all interest only loans upon to 5 years tenor)
“Standard residential” mortgages see increased sensitivity of RW to Loan Valuation Ratios (LVR) while “Non-Standard residential mortgages face a 100% RW across the board irrespective of their LVR
Increased sensitivity to LVR is achieved via a simple recalibration of RW in the Standardised approach and via a reduction in the minimum Loss Given Default (LGD) applied in the IRB approach
The reduced LGD floor also indirectly allows Lenders’ Mortgage Insurance (LMI) to be recognised in the IRB models thereby creating greater alignment with the Standardised approach which directly recognises the value of LMI via a roughly 20% discount in the RW assigned to high LVR loans
APRA is not tinkering at the margins – there are quite substantial adjustments to RWs for both Standardised and IRB ADIs. That is the short version, read on if you want (or need) to dig into the detail.
Improved risk sensitivity cuts both ways
I have looked at “improved risk sensitivity” part of the overall package previously but, with the benefit of hindsight, possibly focussed too much on the expected reduction in aggregate risk weighted assets (RWA) coupled with the expansion of the capital buffers.
It is true that RWA overall are expected to decline – APRA estimated that the overall impact of the proposed revisions would be to reduce average RWAs for IRB ADIs by 10% and by 7% for Standardised ADIs. This obviously translates into higher reported capital ratios which is the impact I initially focussed on. Risk sensitivity however works both ways and a subsequent reading of the paper highlighted (for me at least) the equally important areas in which RW are proposed to increase – residential mortgages in particular.
APRA’s proposed revised approach to residential mortgage risk
APRA was very clear that one of their overall policy objectives is to “further strengthen capital requirements for residential mortgage exposures to reflect risks posed by ADIs’ structural concentration in this asset class“. In pursuit of this objective, APRA is targeting investment and interest only lending in particular but also high LVR lending in general.
In pursuit of these aims, the existing “standard residential mortgage” category is to be further broken down into 1) “Owner Occupied Principal and Interest” loans (OP&I) and 2) “Other Residential”. The “non-standard residential mortgages category (i.e. loans that do not conform to the credit risk origination standards prescribed by APRA) is to be expanded to include interest only loans with a tenor greater than 5 years.
So we get three broad vertical categories of residential mortgage riskiness
Low Risk
Higher risk
Highest risk
Owner Occupied Principal & Interest
– Interest Only (term <5yrs) – Investor mortgage loans – Loans to SME secured by residential property
– Interest Only (term >5yrs) – “Non-standard” mortgages
Note: RW are reduced where loans are covered by LMI but only for Standard Residential Mortgages and only where LVR is above 80%. To be classified as a “standard” mortgage a loan must satisfy minimum enforceability, serviceability and valuation criteria prescribed by APRA.
Impact on the Standardised ADIs
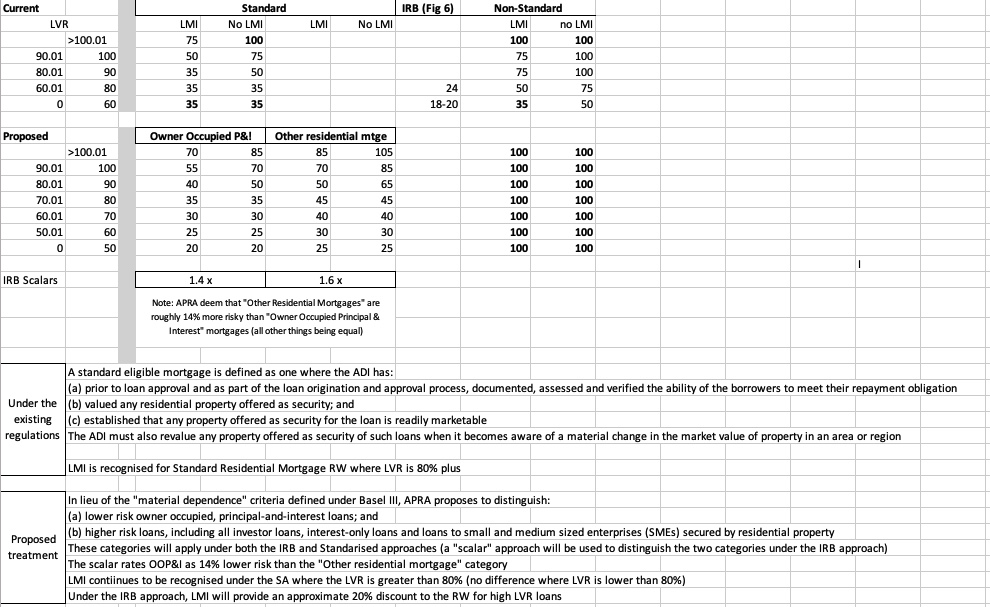
The table below compares the current RWs under the standardised approach (Source: Table 2 of APS 112 – Attachment C) with the indicative RWs APRA has proposed in the December 2020 Discussion Paper (Source: Table 2).
Residential Mortgage Risk Weights – Current and Proposed for Standardised ADIs
The RW within each of the three categories are being substantially recalibrated – APRA is not tinkering at the edges.
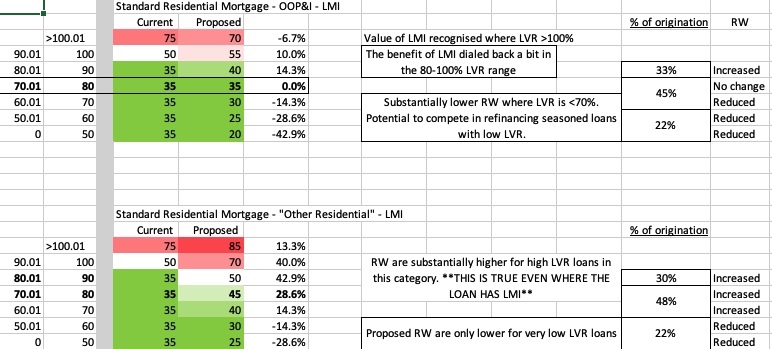
Increased sensitivity to LVR translates to higher RW applying in the upper LVR range but also reductions in the lower LVR range.
The increases in the high LVR ranges are particularly marked in the new “Other Residential” category (30-40% increases) but the reductions in the low LVR range are equally material (14-42%) for the OP&I category
Lender’s Mortgage Insurance (LMI) continues to be recognised at the high end of the LVR range (i.e. 80% plus) but the RW assigned to loans with LMI are higher than is currently applied.
In case anyone was wondering how APRA really felt about non-standard residential mortgages they receive a 100% RW irrespective of their LVR.
Risk weights under the Internal Ratings Based (IRB) Approach
It is a lot harder to figure out exactly what will happen to IRB RW but the starting point is the two new multipliers being added to the IRB RW formula. The OP&I multiplier adds 40% to RW while the Other Residential category gets a 60% loading. These replace the existing “correlation adjustment” factor that was applied to increase the average IRB RW for residential mortgages to a minimum of 25% as part of the effort to reduce the difference between IRB and Standardised capital requirements.
In aggregate, my guess is that the impacts are roughly neutral in the case of the “Other Residential” loans subject to the 60% loading and a net reduction for the OP&I category. The substitution of flat scalars for the existing correlation adjustment does however create some impacts at the upper and lower ends of the PD scale. Under the correlation approach, my understanding is that low PD exposures increase by proportionately more than the average impact and high PD exposures by less. Under scalar approach, the RW are increased by the same percentage across the PD scale. I am not sure how material the impacts are but mention them for completeness. The flat scalars certainly have the advantage of simplicity and transparency but mostly they establish a RW differential between the two types of standard residential mortgage.
The reduced LGD floor is a significant change because it offers the potential for RW to be halved for exposures that can take the maximum advantage. Consistent with the revised standardised RW, I assume that this will be at the lower end of the LVR range. IRB ADIs will have to work for this benefit however as APRA will first have to approve their LGD models. Some ADIs might be well advanced on this front but as a general rule risk modellers tend to have plenty to do and it is hard to see these models having been a priority while the 20% floor has been in place.
It is also worth noting that the risk differential between OP&I and Other Residential mortgages implied by the multipliers employed in the IRB approach is 14% (i.e. 1.6/1.4) is lower than the 20-30% difference in RW proposed to apply in the Standardised approach. This seems to reflect APRA’s response to comments received (section 4.3 of “Response to Submissions”) that the application of different multipliers could double count risks already captured in the PD and LGD assigned to the two different categories of lending by the IRB risk models.
Impacts, implications and inferences
I can see a couple of implications that follow from these proposed changes
LGD models start to matter
The unquestionably strong benchmark is reinforced
Potential to change the competition equilibrium between the big and small banks
LGD models start to matter
The IRB framework has been a part of the Australian banking system for close to two decades but the 20% LGD Floor has meant that residential mortgage LGD models mostly don’t matter, at least for the purposes of measuring capital adequacy requirements. I am not close enough to the action to know exactly what choices were made in practice but the logical response of credit risk modellers would be to concentrate on models that will make a difference.
APRA’s decision to reduce the LGD floor changes the calculus, IRB ADIs now have an incentive to invest the time and resources required to get new LGD models approved. Loan segments able to take full advantage of the 10% floor will be able to more than offset the impact of the multipliers. The LGD has a linear impact on risk weights so a halving from 20 to 10 percent will see risk weights also halve more than offsetting the 40 to 60% loadings introduced by the multipliers.
Exactly where the cut off lies remains to be seen but it seems reasonable to assume that the increases and decreases proposed in standardised risk weights are a reasonable guide to what we might expect in IRB risk weights; i.e. LGD may start to decline below 20% somewhere around the 70% LVR with the maximum benefit (10% LGD) capping out for LVR of say 50% and below. I have to emphasise that these are just semi educated guesses (hopefully anyway) and I am happy to be corrected by anyone with practical experience in LGD modelling. The main point is that LGD modelling will now have some practical impact so it will be interesting to watch how the IRB ADI respond.
Unquestionably strong is reinforced
On one level, it could be argued that the changes in risk weights don’t matter. ADIs get to report higher capital ratios but nothing really changes in substance. Call me a wide-eyed, risk-capital idealist but I see a different narrative.
First up, we know that residential mortgages are a huge risk concentration for the Australian banks so even small changes can have an impact on their overall risk profiles.
“While an individual residential mortgage loan does not, on its own, pose a systemic risk to the financial system, the accumulation of lending by almost all ADIs in this asset class means that in aggregate the system is exposed to heightened risks”
APRA Discussion Paper, “A more flexible and resilient capiutral framework for ADIs”, 8 December 2020 (page 12)
To my mind, the proposed changes can work in a combination of two ways and both have the potential to make a difference. The decline in residential mortgage risk weights is largely confined to loans originated at low LVRs – less than 70% in the case of “Owner-Occupied Principal and Interest” and less than 60% in the case of “Other Residential”. High LVR risk weights (i.e. 90% plus) are reduced for Owner Occupied Principal and Interest without LMI but my understanding is that these kinds 0f loans are exceptions to the rule, granted to higher quality borrowers and not a large share of the overall exposure. High LVR loans as a rule will face higher risk weights under the proposed changes and materially higher in the case of the “Other Residential” category.
In the low LVR lending, the decline in risk weights seems to be largely offset by higher capital ratio requirements via the increased buffers. In the case of the higher risk, high-LVR lending, the higher capital ratio requirements add to the overall dollar capital requirement.
Competition in residential mortgage lending
APRA has explicitly cited “enhancing competition” as one of their objectives. I don’t have enough hard data to offer any comprehensive assessment of the extent to which competition will be enhanced. The one thing I think worth calling out is the substantial reduction in RW assigned to low LVR loans under the Standardised approach. The table below maps the changes in RW with data APRA publishes quarterly on the amount of loans originated at different LVR bands.
Owner occupiers who have managed to substantially reduce the amount they owe the bank have always been an attractive credit risk; even better if appreciation in the value of their property has further reduced the effective LVR. The proposals reinforce the attraction of this category of borrower. The IRB ADIs will not give up these customers without a fight but the Standardised ADI will have an enhanced capacity t0 compete in this segment via the reduced RW.
At this stage we can only speculate on impacts as the final form of the proposals may evolve further as APRA gets to see the results of the Quantitative Impact Statements that the ADI’s are preparing as part of the consultation process.
Summing up
We are still some way way from seeing the practical impact of these changes and we need to see the extent to which the proposals are refined in response to what APRA learns from the QIS. There does however seem to be potential for the economics of residential mortgage lending to be shaken up so this is a development worth keeping an eye on.
Some interesting research out of the UK examining the impact of a variety of factors associated with first time house purchases.
Our results support claim that average FTBs are increasingly higher up the income distribution for their age. And slower than average income growth for younger workers have worked against FTBs. But our results challenge the view that average FTB ages have got much higher. And while FTBs on average are borrowing more in nominal terms, they aren’t spending more of their income on mortgage repayments than before: cheaper credit has roughly cancelled out the effect of bigger mortgages.
Residential mortgages are one of the seemingly more plain vanilla forms of bank lending. Notwithstanding, comparing capital requirements applied to this category of lending across different types of banks can be surprisingly complicated and is much misunderstood. I have touched on different aspects of this challenge in a number of mortgage risk weight “fact check” posts (see here and here), focussing for the most part on the comparison of “standardised” capital requirements compared to those applied to banks operating under the “internal rating based” (IRB) approach.
A discussion paper (“A more flexible and resilient capital framework for ADIs”, 8 December 2020) released by the Australian Prudential Regulation Authority (APRA) offers a good summary (see p27 “Box 2”) of the differences in capital requirements not captured by simplistic comparisons of risk weights. However, one of the surprises in the discussion paper was that APRA chose not to address one of these differences by aligning the credit conversion factors applied to off-balance sheet (non-revolving) residential mortgage exposures.
Understanding why APRA chose to maintain a different treatment of CCFs across the two approaches offers some insights into differences in the way that the two approaches recognise and measure the underlying risks.
Before proceeding we need to include a short primer on “off-balance exposures” and “CCFs”. Feel free to skip ahead if you already understand these concepts.
Off-balance sheet exposures are the difference between the maximum amount a bank has agreed to lend and the actual amount borrowed at any point in time.
The CCF is the bank’s estimate of how much of these undrawn limits will in fact have been called on (converted to an on balance sheet exposure) in the event a borrower defaults.
In the case of “non-revolving” residential mortgages, these off-balance sheet exposures typically arise because borrowers have got ahead of (“pre-paid”) their contractual loan repayments.
APRA noted that the credit conversion factor (CCF) currently applied to off-balance sheet exposures was much higher for IRB banks than for standardised, thereby partially offsetting the lower risk weights applied under the IRB approach. It had been expected that APRA would address this inconsistency by applying a 100% CCF under both approaches.
Contrary to this expectation, APRA has proposed to revise the CCFs applying to (non-revolving) off-balance sheet residential mortgage exposures as follows:
Current
Standardised 0-50%
IRB 100%
Proposed
40%
100% (unchanged)
The interesting nuance here is that APRA is not saying that standardised banks are likely to experience a lower percentage drawdown of credit limits in the event a borrower defaults. In the “Response to Submissions” that accompanied the Discussion Paper, APRA noted that “Borrowers do not typically enter default until they have fully drawn down on their available limit, including any prepayments ahead of their scheduled balance.”
However, APRA also noted that loans with material levels of prepayment are also likely to be lower risk based on the demonstrated greater capacity to service and repay the loan.
Under the IRB approach, the greater capacity to repay the loan is generally recognised through a lower PD estimate which the IRB formula translates into lower risk weights reflecting the lower risk. In the absence of some equivalent risk recognition mechanism in the standardised approach, APRA is proposing to use a concessional CCF treatment to reflect the lower risk of loans with material levels of prepayment. It notes that the concessional CCF treatment will also contribute to ensuring the difference in residential mortgage capital requirements between the standardised and IRB approaches remains appropriate.
Summing up:
Looked at in isolation, 100% is arguably the “right” value for the CCF to apply to off-balance sheet exposures for a non-revolving residential mortgage irrespective of whether it is being measured under the standardised or IRB approach
But a “concessional” CCF is a mechanism (fudge?) that allows the standardised approach to reflect the lower risk associated with loans with material levels of prepayment
I have posted a number of times on the question of residential mortgage risk weights, either on the general topic of the comparison of the risk weights applied to the standardised and IRB ADIs (see here) or the reasons why risk weights for IRB ADIs can be so low (see here).
On the question of relative risk weights, I have argued that the real difference between the standardised and IRB risk weights is overstated when framed in terms of simplistic comparisons of nominal risk weights that you typically read in the news media discussion of this question. I stand by that general assessment but have conceded that I have paid insufficient attention to the disparity in risk weights at the higher quality end of the mortgage risk spectrum.
A Discussion Paper released by APRA offers a useful discussion of this low risk weight question as part of a broader set of proposals intended to improve the transparency, flexibility and resilience of the Australian capital adequacy framework.
In section 4.2.1 of the paper, APRA notes the concern raised by standardised ADIs…
A specific concern raised by standardised ADIs in prior rounds of consultation has been the difference in capital requirements for lending at low LVRs. Stakeholders have noted that the lowest risk weight under the standardised approach would be 20 per cent under the proposed framework, but this appears to be significantly lower for the IRB approach. In response to this feedback, APRA has undertaken further analysis at a more detailed level, noting the difference in capital requirements that need to be taken into account when comparing capital outcomes under the standardised and IRB approaches (see Box 2 above).
But APRA’s assessment is that the difference is not material when you look beyond the simplistic comparison of risk weights and consider the overall difference in capital requirements
APRA does not consider that there is a material capital difference between the standardised and IRB approaches at the lower LVR level. For loans with an LVR less than 60 per cent, APRA has estimated that the pricing differential that could be reasonably attributed to differences in the capital requirements between the two approaches would be lower than the differential at the average portfolio outcome.
In explaining the reasons for this conclusion, APRA addresses some misconceptions about the IRB approach to low LVR lending compared to the standardised approach
In understanding the reasons for this outcome, it is important to understand the differences in how the standardised and IRB approaches operate. In particular, there are misconceptions around the capital requirement that would apply to low LVR lending under the IRB approach. For example, it would not be appropriate to solely equate the lowest risk weight reported by IRB ADIs in market disclosures with low LVR loans. The IRB approach considers a more complex range of variable interactions compared to the standardised approach. Under the standardised approach, a low risk weight is assigned to a loan with a low LVR at origination.
One of the key points APRA makes is that IRB ADIs do not get to originate loans at the ultra low risk weights that have been the focus of much of the concern raised by standardised ADIs.
In particular, IRB estimates are more dynamic through the life of the loan, for example, they are more responsive to a change in borrower circumstances or movements in the credit cycle. Standardised risk weights generally do not change over the life of a loan. For an IRB ADI, the lowest risk weight is generally applied to loans that have significantly prepaid ahead of schedule. A low LVR loan on the standardised approach is not necessarily assigned the lowest risk weight under the IRB approach at origination.
APRA states that it is not appropriate to introduce “dynamic”factors into the standardised risk weight framework.
APRA is not proposing to include dynamic factors in determining risk weights under the standardised approach for the following reasons:
– the standardised approach is intended to be simple and aligned with Basel III. For the standardised approach, APRA considers it more appropriate to focus on origination rather than behavioural variables as this has more influence on the quality of the portfolio and leads to less procyclical capital requirements; and
– the average difference between standardised and IRB capital outcomes is much narrower at the point of origination, which is the key point for competition. While the difference between standardised and IRB capital outcomes could widen over the life of the loan, APRA has ensured that the difference in average portfolio outcomes remains appropriate
But that it does intend to introduce a 5 per cent risk weight floor into the IRB approach to act as a backstop.
That said, APRA is proposing to implement a 5 per cent risk-weight floor for residential mortgage exposures under the IRB approach, to act as a simple backstop in ensuring capital outcomes do not widen at the lower risk segment of the portfolio. This is consistent with the approach taken by other jurisdictions and will limit the difference in capital outcomes between the standardised and IRB approaches for lower risk exposures. This risk-weight floor is in addition to other factors that will reduce the difference in capital outcomes between standardised and IRB ADIs, such as the higher CCB for IRB ADIs and lower CCF estimates for standardised ADIs.
As always, it remains possible that I am missing something. The explanation offered by APRA however gives me confidence that my broad argument about the overstatement of the difference has been broadly correct. Equally importantly, the changes to residential mortgage risk weights proposed in the Discussion Paper will further reduce the gap that does exist.
There is a surprising (to me at least) variety of ways that countries address the common problem of financing the purchase of residential property. To date, I have mostly approached the question from the perspective of trying to understand differences in mortgage risk weights across different banks in Australia (see here). The topic also has implications for cross border comparisons of capital adequacy ratios (see here and here).
Marc Rubinstein wrote a great piece looking at the mysteries of the the 30-year fixed-rate fully prepayable mortgage that finances the majority of home purchases in America. Marc noted in passing that Denmark is the only other country that offers a comparable form of mortgage financing. That is broadly true but I think the Danish mortgage financing system has some distinct and intriguing features of its own. A paper published by the New York Fed in 2018 comparing the US and Danish mortgage systems has been especially useful in gaining some deeper insights into the different ways that countries solve the residential property finance challenge.
This extract from the New York Fed paper gives you a flavour of the history and main features of the Danish system
In Denmark, mortgage lending has long been dominated by specialized mortgage banks. Denmark’s first mortgage bank was established in 1797, and Nykredit, the country’s largest mortgage bank today, traces its origins to 1851 (Møller and Nielsen 1997). Originally, these firms were set up as mutual mortgage credit associations with a local focus. But several waves of mergers—some encouraged or even prescribed by their then-regulator—led to the formation of the handful of large mortgage banks that today dominate mortgage lending in Denmark.
Because the original mortgage credit associations were founded by borrowers, lending terms were to a large extent designed to reflect borrowers’ objectives and interests. At the same time, the associations needed to build trust among the investors in covered bonds, and this led to a business model aimed at balancing borrower and investor interests (Møller and Nielsen 1997).
Key aspects of this business model included:
# Mortgage lenders could not call for early redemption of a loan unless the borrower became delinquent.
# Investors could not call the covered bonds.
# Homeowners had a right to prepay the mortgage loan at par on any payment day without penalty.
# Homeowners were personally liable for the mortgage debt.
# Homeowners were jointly and severally liable for the covered bonds issued by the mortgage credit association.
# Mortgage margins could be increased for the entire stock of mortgage loans—for example, if needed in order to increase capitalization or cover loan losses.
# Strict lending guidelines were instituted that were regulated by law (maximum LTV ratio, maximum maturity, and so forth).
With the exception of joint and several liability, these principles still apply to mortgage banks today.
Berg J, Baekmand Nielsen M, and Vickery J, “Peas in a Pod? Comparing the U.S. and Danish Mortgage Financing Systems”, Federal Reserve Bank of New York Economic Policy Review 24, no. 3, December 2018
The paper summarises the comparison between the two systems as follows
The U.S. and Danish mortgage finance models both rely heavily on capital markets to fund residential mortgages, transferring interest rate and prepayment risk, but not credit risk, to investors. But in Denmark, homeowners can buy back their mortgages or transfer them in a property sale, avoiding the “lock-in” effects present in the U.S. system, and easier refinancing reduces defaults and speeds the transmission of lower interest rates in a downturn. Denmark’s tighter underwriting standards and strong creditor protections help limit credit losses, while its higher capital requirements make lenders more stable.
I have touched on residential mortgage risk weights a couple of times in this blog, most recently in a post on the Dutch proposal to increase residential mortgage RW. This post explores the question of why residential mortgage RW under the Internal Rating Based (IRB) approach can be so low. More importantly, can we trust these very low risk weights (and the banks generating them) or is this yet more evidence that the IRB approach is an unreliable foundation for measuring bank capital requirements? It also touches on some of the issues we encounter in cross border comparisons of capital strength.
It has to be said at this point that IRB modelling is not an area where I claim deep expertise and I would welcome comments and input from people who do have this subject matter expertise. However, it is an important issue given the role that residential mortgage lending plays both in the economy as a whole. If nothing else, the post will at least help me get my thoughts on these questions into some kind of order and potentially invite comments that set me straight if I have got anything wrong. Notwithstanding the importance of the issue, this post is pretty technical so likely only of interest if you want to dig into the detailed mechanics of the IRB approach.
Recapping on the Dutch proposal to increase mortgage risk weights
First a recap on what the Dutch bank supervisor proposes to do. Residential mortgage RW in the Netherlands are amongst the lowest observed in Europe
DNB:Financial Stability Report Autumn 2019
The Dutch banks can of course cite reasons why this is justified but, in order to improve the resilience of the banking system, the Dutch banking supervisor proposes to introduce a floor set at 12% on how low the RW can be. The 12% floor applies to loans with a dynamic Loan to Value (LTV) of 55% or lower. The RW floor increases progressively as the LTV increases reaching a maximum of 45% for loans with a LTV of 100% or more. DNB expects the application of the measure to increase the average risk weights of Dutch IRB banks by 3-4 percentage points (from 11% to 14%-15%).
What drives the low end of the IRB Mortgage RW?
None of the discussion set out below is in any way intended to challenge bank supervisors seeking to apply limits to the low mortgage risk weights we observe being generated by the internal models developed by IRB banks. That is a whole separate discussion but the move to higher RW on these exposures broadly makes sense to me, not only for reasons of systemic resilience, but also with regard to the way that it reduces the disparity between IRB RW and those the standardised banks are required to operate against. It is however useful to understand what is driving the model outcomes before citing them as evidence of banks gaming the system.
This extract from Westpac’s September 2019 Pillar 3 Report shows a weighted average RW of 24% with individual segments ranging from 6% to 137%. The CBA Pillar 3 shows a similar pattern (RW range from 4.4% to 173.5%). I won’t get too much into the technical detail here but the effective IRB RW is higher when you factor in Regulatory Expected Loss. The impact on the RW in the table below is roughly 16% on average (I divide REL by .08 to translate it to an RWA equivalent and then divide by RWA) but this effect only becomes material for the 26% and higher RW bands).
Source: Westpac Pillar 3 Report – Sep 2019
I am very happy to stand corrected on the facts but my understanding is that the 6% and 14% RW bands in the table above capture “seasoned” portions of the loan portfolio where the Loan to Valuation (LVR) ratio has declined substantially from the circa 80% plus typically observed in newly originated loans. The declining LVR is of course a natural outcome for Principal and Interest loans which is the kind traditional prudent banking prefers.
What at face value looks like an incredibly thin capital requirement starts to make more sense when you consider the fact that the borrowers in these segments have demonstrated their capacity to service their loans and, perhaps more importantly, have built up a substantial pool of their own equity in the property that will absorb very substantial declines in property prices before the bank is likely to face a loss.
Australian owner occupied borrowers have an incentive to repay as fast as possible because their interest is not tax deductible (making the mortgage repayment one of the best applications of surplus cash) and they typically borrow on a floating rate basis. The natural amortisation of loan principal is also likely to have been accelerated by the progressive decline in interest rates in recent years which has seen a large share of borrowers apply the interest saving to higher principal repayments.
Comparing Dutch and Australian Mortgage Risk Weights
Looking at the Dutch RW provides some perspective on the mortgage RW of the Australian IRB banks and the initiatives APRA has implemented to increase them. I will only scratch the surface of this topic but it is interesting none the less to compare the 14-15% average RW the Dutch IRB banks will be required to hold with the 25% average RW that Australian IRB banks must hold.
The Dutch banks cite a favourable legal system that supports low LGD by allowing them to quickly realise their security on defaulted loans. That is a sound argument when you are comparing to a jurisdiction where it can take up to 3 years for a bank to gain access to the security underpinning a defaulted loan. That said, the Australian banks can make a similar argument so that does not look like a definitive factor in favour of lower Dutch RW.
The Australian LTV is based on the amortised value of the loan compared to the value of the property at the time the loan was originated. The Dutch LTV as I understand it seem to includes the updated value of the property as the loan ages. Again I don’t see anything in the Dutch system that renders their residential mortgage lending fundamentally less risky than the Australian residential mortgage.
The other positive factor cited by the Dutch banks is the tax deductibility of mortgage interest which applies even where the property is owner occupied. In Australia, interest on loans for owner occupied property is not tax deductible. The Dutch banks argue that the tax deduction on interest enhances the capacity of the borrower to service a loan but my guess is that this advantage is highly likely to be translated into higher borrowing capacity and hence higher property prices so it is not clear that there is a net improvement in the capacity to repay the loan.
I obviously only have a very rudimentary understanding of Dutch tax rules but my understanding is that tax deductibility of interest expense in some European jurisdictions is quid pro quo for including the implied value of rental on the property in the owner’s taxable income. If that is the case then it looks like tax deductibility of interest is a zero sum game from the lending bank perspective. Qualified by the caveats above, I will provisionally take the side of the Australian mortgage in this comparison. It seems equally likely to me that the the absence of a tax deduction creates an incentive for Australian borrowers to repay their loan as quickly as possible and hence for a greater proportion of loans outstanding to move into the low LVR bands that insulate the bank from the risk of loss. There does not seem to be the same incentive in the Dutch system, especially where the loans are fixed rate.
Summing up
The purpose of this post was mostly to help me think through the questions posed in the introduction. If you are still reading at this point then I fear you (like I) take bank capital questions way too seriously.
There are two main points I have attempted to explore and stake out a position on:
What at face value looks like an incredibly thin capital requirement for some parts of the residential mortgage portfolio start to make more sense when you consider the fact that the borrowers in these segments have demonstrated their capacity to service their loans and have built up a substantial pool of their own equity in the property that will absorb very substantial declines in property prices before the bank is likely to face a loss.
Cross border comparisons of capital are complicated but mortgages are a big part of the Australian bank risk profile and I still feel like they stack up relatively well in comparison to other jurisdictions that cite structural reasons why theirs are low risk.
If you have some evidence that contradicts what I have outlined above then by all means please let me know what I am missing.
I post on a range of topics in banking but residential mortgage risk weights is one that seems to generate the most attention. I first posted on the topic back in Sep 2018 and have revisited the topic a few times (Dec 2018, June 2019#1, June 2019#2, and Nov 2019) .
The posts have tended to generate a reasonable number of views but limited direct engagement with the arguments I have advanced. Persistence pays off however because the last post did get some specific and very useful feedback on the points I had raised to argue that the difference in capital requirements between IRB and Standardised Banks was not as big as it was claimed to be.
My posts were a response to the discussion of this topic I observed in the financial press which just focussed on the nominal difference in the risk weights (i.e. 25% versus 39%) without any of the qualifications. I identified 5 problems with the simplistic comparison cited in the popular press and by some regulators:
Problem 1 – Capital adequacy ratios differ
Problem 2 – You have to include capital deductions
Problem 3 – The standardised risk weights for residential mortgages seems set to change
Problem 4 – The risk of a mortgage depends on the portfolio not the individual loan
Problem 5 – You have to include the capital required for Interest Rate Risk in the Banking Book
With the benefit of hindsight and the feedback I have received, I would concede that I have probably paid insufficient attention to the disparity between risk weights (RW) at the higher quality end of the mortgage risk spectrum. IRB banks can be seen to writing a substantial share of their loan book at very low RWs (circa 6%) whereas the best case scenario for standardised banks is a 20% RW. The IRB banks are constrained by the requirement that their average RW should be at least 25% and I thought that this RW Floor was sufficient to just focus on the comparison of average RW. I also thought that the revisions to the standardised approach that introduced the 20% RW might make more of a difference. Now I am not so sure. I need to do a bit more work to resolve the question so for the moment I just want to go on record with this being an issue that needs more thought than I have given it to date.
Regarding the other 4 issues that I identified in my first post, I stand by them for the most part. That does not mean I am right of course but I will briefly recap on my arguments, some of the push back that I have received and areas where we may have to just agree to disagree.
Target capital adequacy ratios differ materially. The big IRB banks are targeting CET1 ratios based on the 10.5% Unquestionably Strong Benchmark and will typically have a bit of a buffer over that threshold. Smaller banks like Bendigo and Suncorp appear to operate with much lower CET1 targets (8.5 to 9.0%). This does not completely offset the nominal RW difference (25 versus 39%) but it is material (circa 20% difference) in my opinion so it seem fair to me that the discussion include this fact. I have to say that not all of my correspondents accepted this argument so it seems that we will have to agree to disagree.
You have to include capital deductions. In particular, the IRB banks are required to hold CET1 capital for the shortfall between their loan loss provision and a regulatory capital value called “Regulatory Expected Loss”. There did not appear to be a great awareness of this requirement and a tendency to dismiss it but my understanding is that it can increase the effective capital requirement by 10-12% which corresponds to an effective IRB RW closer to 28% than 25%.
The risk of a mortgage depends on the overall portfolio not the individual loan. My point here has been that small banks will typically be less diversified than big banks and so that justifies a difference in the capital requirements. I have come to recognise that the difference in portfolio risk may be accentuated to the extent that capital requirements applied to standardised banks impede their ability to capture a fair share of the higher quality end of the residential mortgage book. So I think my core point stands but there is more work to do here to fully understand this aspect of the residential mortgage capital requirements. In particular, I would love get more insight into how APRA thought about this issue when it was calibrating the IRB and standardised capital requirements. If they have spelled out their position somewhere, I have not been able to locate it.
You have to include the capital required for Interest Rate Risk in the Banking Book (IRRBB). I did not attempt to quantify how significant this was but simply argued that it was a requirement that IRB banks faced that standardised banks did not and hence it did reduce the benefit of lower RW. The push back I received was that the IRRBB capital requirement was solely a function of IRB banks “punting” their capital and hence completely unrelated to their residential mortgage loans. I doubt that I will resolve this question here and I do concede that the way in which banks choose to invest their capital has an impact on the size of the IRRBB capital requirement. That said, a bank has to hold capital to underwrite the risk in its residential mortgage book and, all other thinks being equal, an IRB bank has to hold more capital for the IRRBB requirement flowing from the capital that it invests on behalf of the residential mortgage book. So it still seems intuitively reasonable to me to make the connection. Other people clearly disagree so we may have to agree to disagree on this aspect.
Summing up, I had never intended to say that there was no difference in capital requirements. My point was simply that the difference is not as big as is claimed and I was yet to see any analysis that considered all of the issues relevant to properly understand what the net difference in capital requirements is. The issue of how to achieve a more level playing field between IRB and Standardised Banks is of course about much more than differences in capital requirements but it is an important question and one that should be based on a firmer set of facts that a simplistic comparison of the 39% standardised versus 25% IRB RW that is regularly thrown around in the discussion of this question.
I hope I have given a fair representation here of the counter arguments people have raised against my original thesis but apologies in advance if I have not. My understanding of the issues has definitely been improved by the challenges posted on the blog so thanks to everyone who took the time to engage.
I have posted a couple of times on the merits of the argument that differences in mortgage risk weights are a substantial impediment to the ability of small banks employing the standardised approach to compete against larger banks who are authorised to use the Internal Ratings Based approach.
There was some substance to the argument under Basel II but the cumulative impact of a range of changes to the IRB requirements applying to residential mortgages has substantially narrowed the difference in formal capital requirements.
APRA has commented on this issue previously but that did not seem to have much impact on the extent to which the assertion gets repeated. For anyone still reluctant to let the facts stand in the way of a good story, Wayne Byres has restated APRA’s view on the issue in a speech to the Customer Owned Banking Association’s 2019 conference.
That brings me to the final point I want to make, about mortgage risk weights. Much is made of the headline difference in risk weights between the IRB and standardised approaches. At first glance, they do indeed look different. But as we pointed out in our most recent discussion paper, the comparison is much more complex than a superficial comparison implies: there are differences in capital targets, the treatment of loan commitments, the application of capital for interest rate risk in the balance sheet, and adjustments to expected losses – all of which have the effect of adding to IRB bank capital requirements and mean that the headline gap is greatly narrowed in practice.
When looked at holistically, we think any gap is small. Perhaps most tellingly, we now hear from candidates for IRB status that they are concerned the proposals being developed will not provide them with any capital benefit whatsoever. Whether that is the case or not, we are very conscious of this issue in designing the new proposals, and we have explicitly stated that we intend that any differences will remain negligible.
APRA Chair Wayne Byres – Speech to COBA 2019, the Customer Owned Banking Convention – 11 November 2019
Hopefully that settles the question. There is no question that all banks should be able to compete, as far as possible, on a level playing field but complaints about vast differences in the capital requirements applying to residential mortgages are a distraction not a solution.